As I write this on June 8th in Taiwan it has been 13 days since the events in Minnesota led to daily nation- and world-wide protests and assembly in the streets. Videos of the public events show that, for the most part, facial masks are not being worn and certainly six-foot social distancing is being ignored.
Since COVID-19 has an average time from exposure to symptoms of five days that means that any exposure during these protests of hundreds in the streets from June 3rd or before should be showing up in the daily case rates. It also means that the remarkable, highly specific property of the SARS-CoV-2 to infect the cells that give us taste and smell and that lead people to go online and do searches for “can’t taste or can’t smell” can be an indicator of new cases, even for people that don’t go to the doctor.
In fact, I used this unusual taste/smell change by SARS-CoV-2 to determine when it first came to America.
A week ago I published a manuscript with an esteemed statistics professor from UCLA that showed that COVID-19 probably was in America in late 2019 and was killing people, at least in California, in early January. You can read the article here. What this means is that many, many of us have been exposed to this virus and either had no symptoms or only mild symptoms. The implications of this are immense: in calculating the death rate from SARS-CoV-2 the top number in the fraction (the numerator) is the number of deaths, which we know pretty accurately. The denominator can be the harder number to come by, the total number of cases, especially if you miss the asymptomatic cases or miss the January and early community cases where people got a little sick and wrote it off to the seasonal influenza. This of course segues to the probably mistaken decision to close a country for a virus that might be no more deadly than the typical influenza.
But back to the topic of the potential flare-up from breaking the shelter-in-place and social distancing rules.
So what is happening in the US nation-wide right now? First, let’s look at the folks who don’t go to the doctor maybe but still have the loss of taste/smell symptom, meaning they are infected.
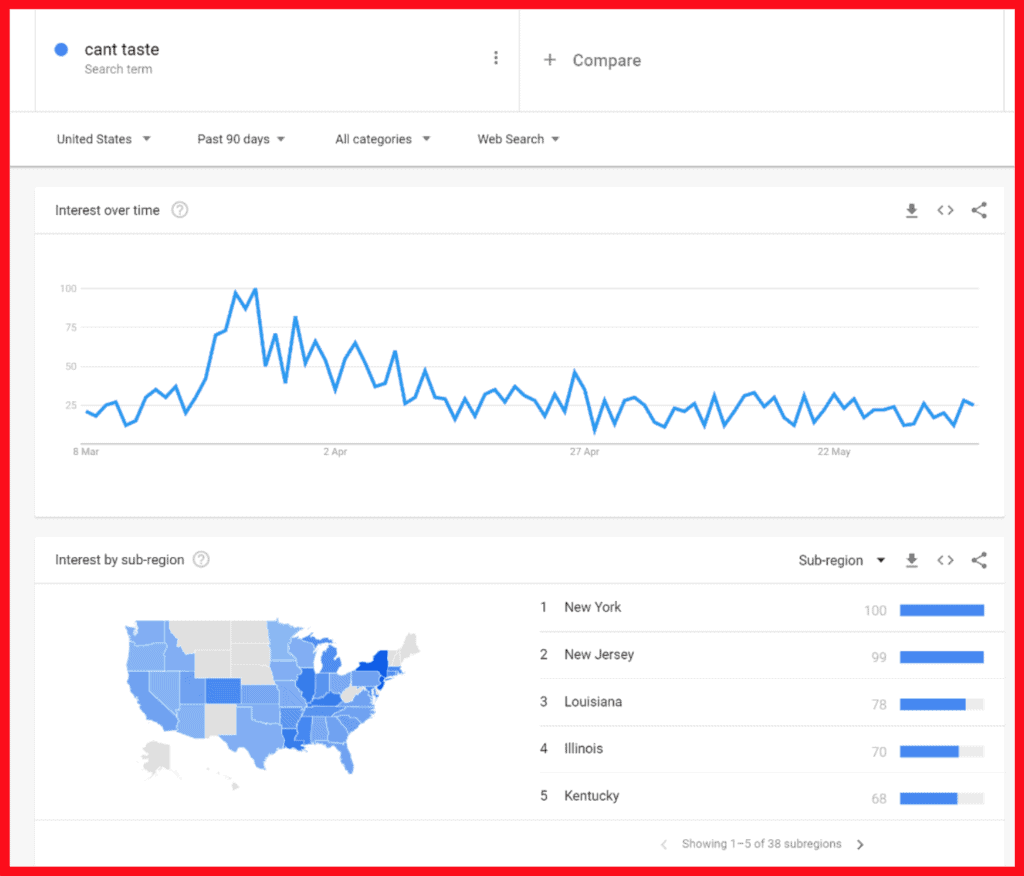
Above is the trend of Google searches1 for ‘can’t taste’ nationwide over the last 90 days. It peaked 23-25 March and has been steadily declining ever since. The slope of the line from before and after the events in Minnesota is unchanged. This suggests there is no spike or trend in new cases. So this provides no evidence that breaking the rules has caused a spike and suggests we can end the policies.
But what about people who actually show up in a clinical or hospital and get tallied into the official state or CDC database?
Below is a table of the states that are willing to share their data2 with the trend in new cases and deaths. Note: it usually takes longer than 14 days to die from COVID-19 so the trend in deaths has nothing to do with the recent spontaneous breaking of the ‘public health rules’ about COVID-19. I include it for its informational content value.
If your state is not on this list it is because they are not sharing their data on COVID-19 with the CDC or WHO. You should contact them and ask that they do so.
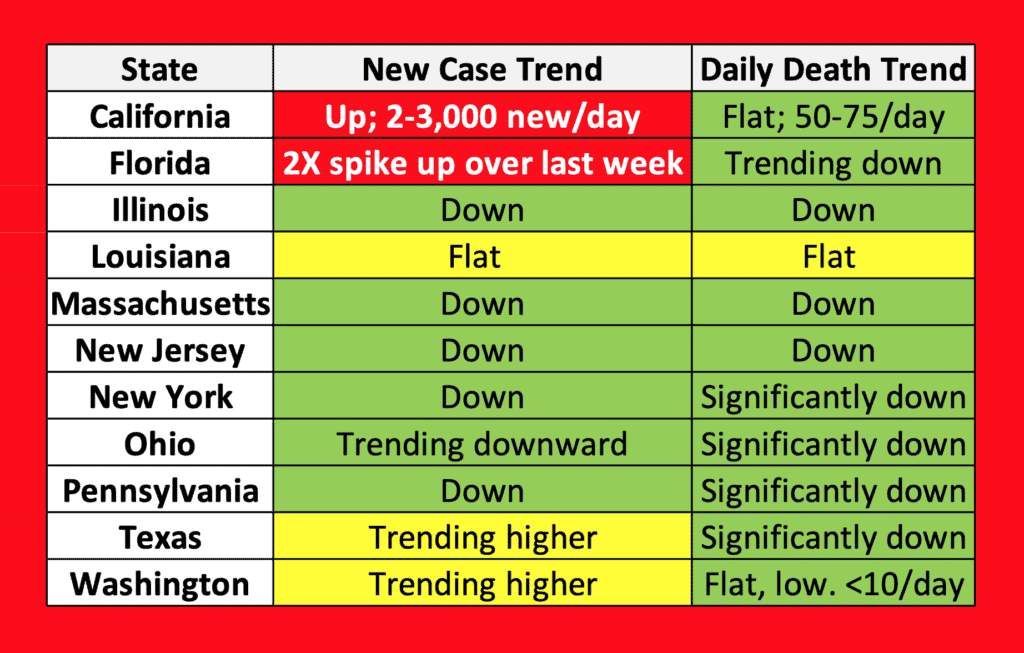
First the really good news. Deaths from COVID-19 are down everywhere except Louisiana, where they are flat. Again, this has no current relationship to the public assemblies going on but it is just a bit of good news for a change.
With respect to new cases, California, Florida, and Washington are seeing the caseload grow. It is a linear and not exponential growth like at the beginning but it is growing just the same. It does contradict the data I analyzed last week on cases decreasing as the temperature goes up; both California and Florida can be our warmest states so it looks like summer heat will not stop this villain.
So let’s look at California. The way to do this is to look at a smoothed moving average of the new cases before and after May 25th and look for an upward change in the slope.
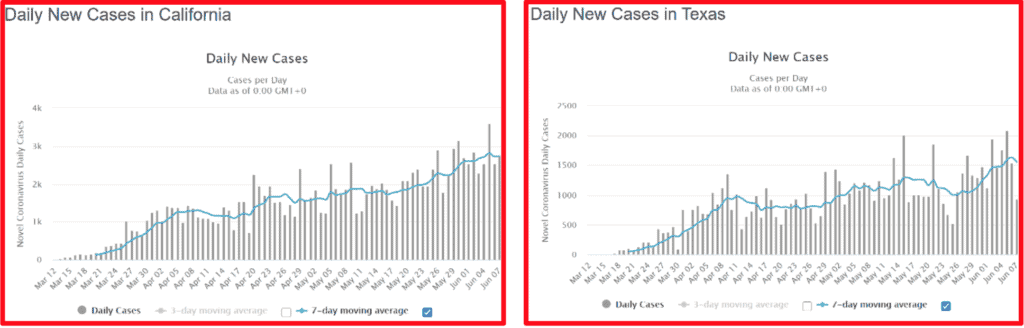
Above are the daily cases and the blue line is the moving slope. For California (on the left) there is no upward change in slope of cases after May 25 and in fact there is a slight downward slope at the end. So no signal in California related to protests. Texas shows the opposite effect: a downward slope going into the time of the protests that is broken and now trending upward. It also has a one day drop but we should still assume there is a positive relationship here between the protests and the cases. This would support a hypothesis that the protests are increasing the cases of COVID-19 in Texas. But remember correlation (two things happening at the same time) is not the same as causation.
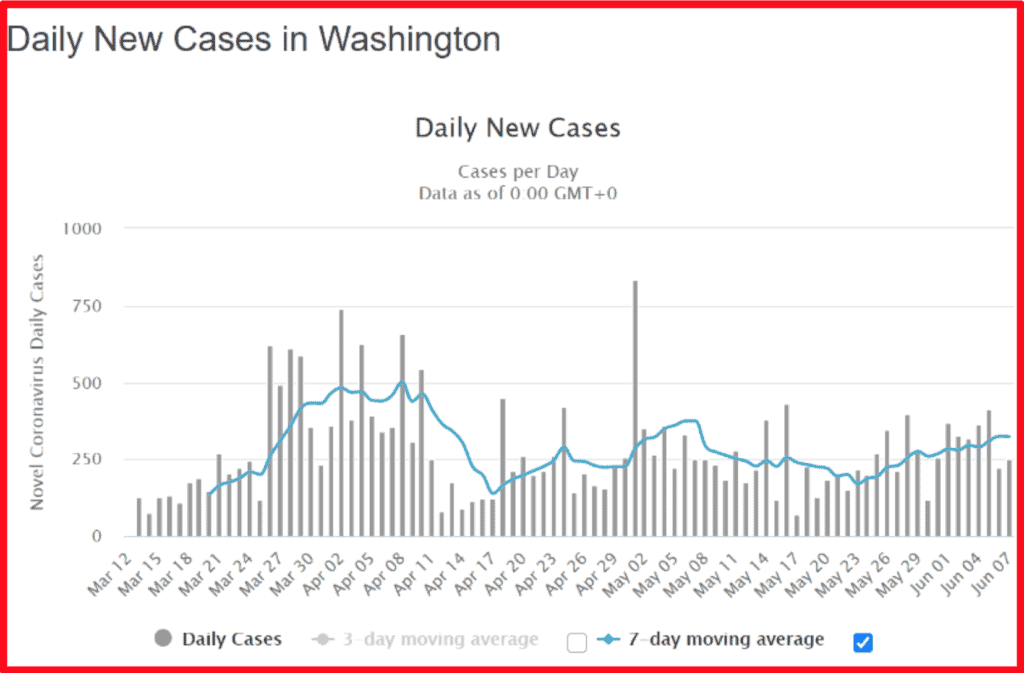
Washington State has the same kind of trend line as Texas with a change in slope around the time the protests began. So again, this is probably an example of the impact of stopping the COVID-19 policies: a measurable change if you look really hard at the data but certainly not something to continue to stop an economy for.
Conclusion. The nationwide protests has provided a useful experiment in whether it is time to end the shelter-in-place and social distancing policies of the last few months. The answer is that there is no evidence of an exponential growth in cases, any growth that is seen is minor, and so the policies should be ended.
Is there a recommendation for further COVID-19 policies after shelter-in-place is over? Yes, I recommend what I call the Taiwan policies. Remember, Taiwan has only seven COVID-19 deaths and about 1% of the cases per million population of anywhere else in the world.
Here is what is happening in Taiwan right now:

